
(solid barrier). The following curves show that the gas wave flow in the
shock tube results in a relatively weak shock wave attennuation. The values
of the reflected shock wave amplitude and the pressure in the vicinity of
the left boundary are on a relatively high leve l
z
≈
80
,
p
≈
12
atm, but
the temperature has dropped to
T
≈
0
.
4
кK. By this moment of time, in
the most part of the computed zone, the pressure and temperature have
almost similar values
T
≈
0
.
4
кK,
P
≈
3
.
5
atm, but they are quite high in
comparison with the initial conditions in the low pressure chamber. It can
be explained by the active processes of relaxation occurring in the shock
tube. It is interesting that if the processes of equalization in the shock
tube had completely come to an end, then the values of termodynamic
parameters
T
≈
0
.
12
кK,
p
≈
1
.
63
atm would have been set.
It should be noted, that the proposed computational algorithm, which
is intended for numerical modeling of aerothermophysical characteristics
of the aerodynamic shock tubes, is to be compared with the published
computational and experimental results.
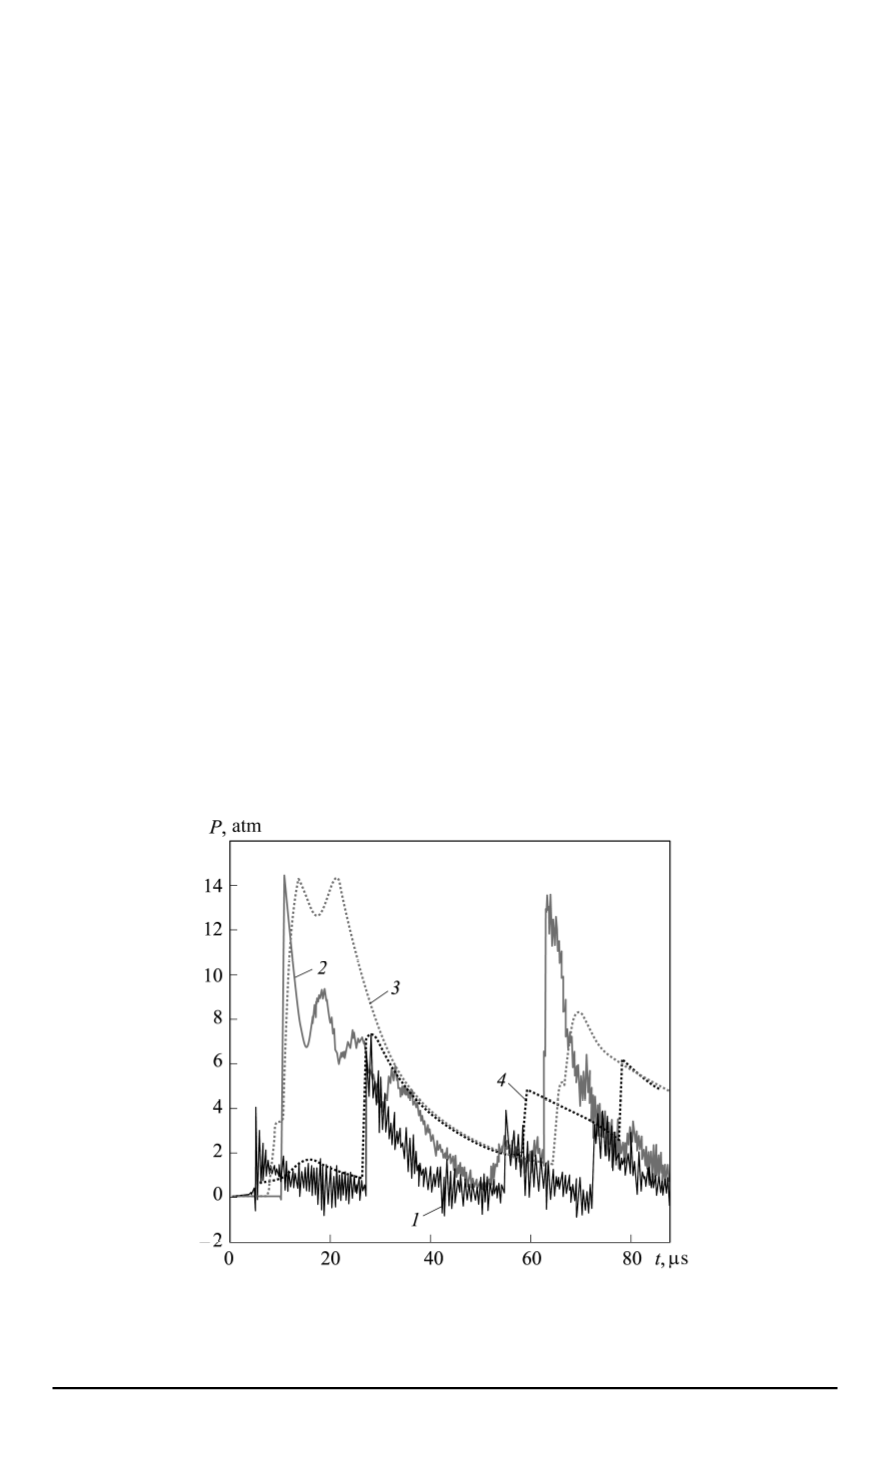
For this purpose, experimental and computational time dependences
obtained for pressure gauges 2 and 3 were compared (Fig. 8). From the
graphs of the experimental dependences (it 1, it 2) it follows that the
first period of pressure
P
(
t
)
change (and for gauge 2 — both the first
and the second periods) differ noticeably from the following periods. This
difference might be caused by the “transition” processes (which can be
caused by the gas outflowing through the Laval nozzle and various factors
distorting the one-dimensional flow pattern in the shock tube) occurring
Fig. 8. Experimental (
1
and
2
) and computational (
3
and
4
) time dependences for
the second (
1
and
4
) and third (
2
and
3
) pressure gauges (Experiment 4) (dashed
line — computation; solid line — experiment)
ISSN 0236-3941. HERALD of the BMSTU. Series “Mechanical Engineering”. 2014. No. 1 21


