


 15 / 21

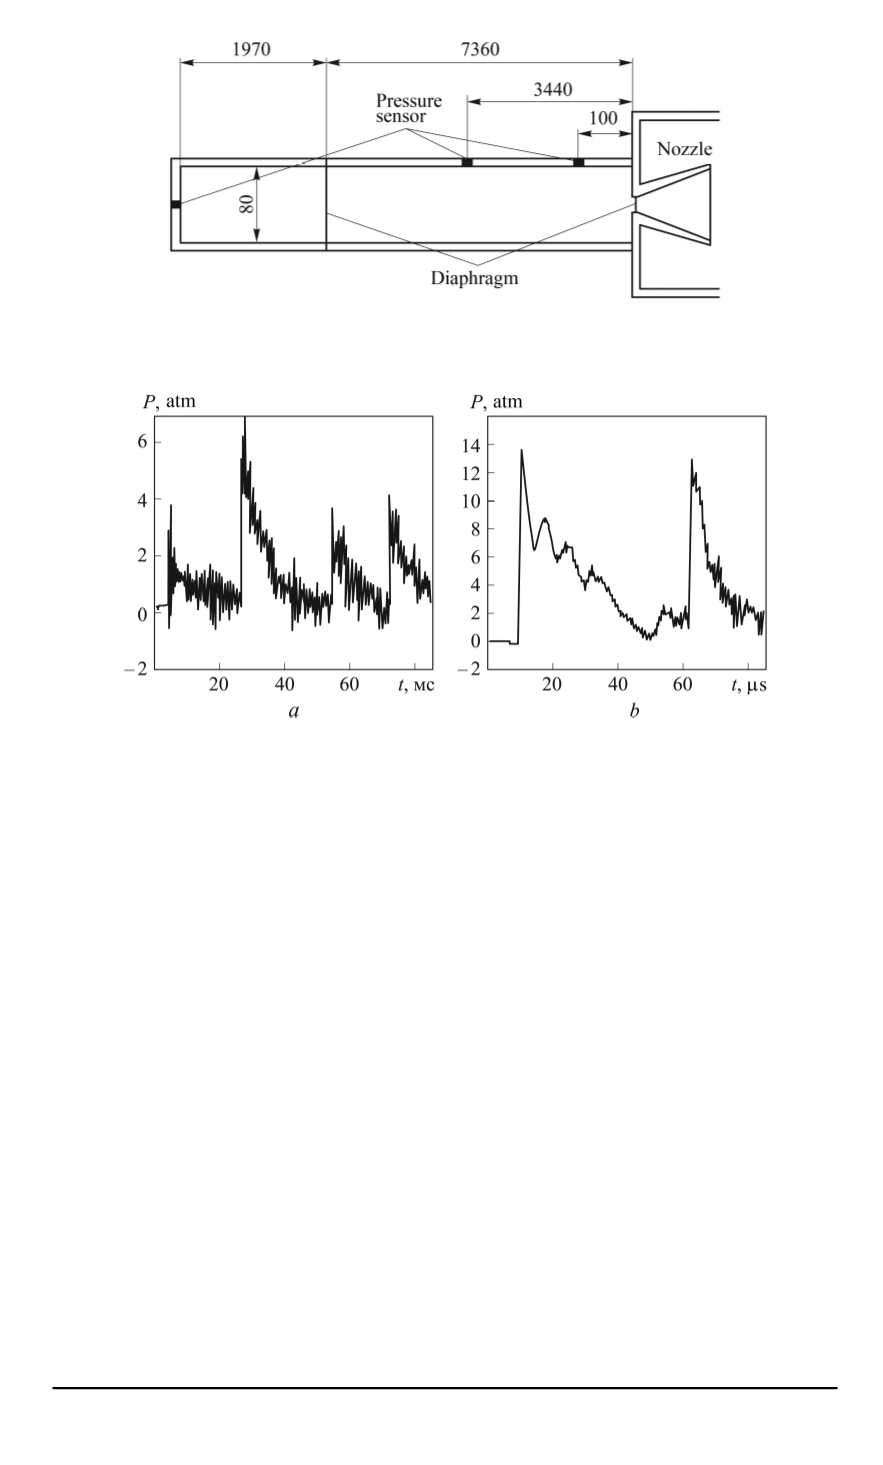
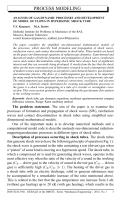
Fig. 2. The layout chart of pressure gauge locations in one-diaphragm shock tube (at
the Institute for Problem Mechanics, RAS)
Fig. 3. Experimental time dependencies for the second (
a
) and third (
b
) pressure
gauges (Experiment 4)
the graphic curve of pressure gauge 2 (
z
= 5
.
78
m), it follows that the
observed maximum of the amplitude corresponds not to the initial shock
wave arrival, i.e., not to the time
t
≈
9
ms, but to a later instant
t
≈
30
ms.
This phenomenon might be associated with the fact that at the moment
of time
t
≈
30
ms, at the point where gauge 2 is installed (approximately
near the center of the computed area), the shock wave amplification after
its reflection from the end surfaces of the shock tube is significantly higher
that its attenuation during its interaction with rarefaction waves. These
graphic curves also indicate that the further (relative to time) gas wave
motion in a shock tube results in shock wave attenuation and the transition
of the flow into the acoustic wave movement.
Thus, it may be noted that the unsteady gas flowing in the aerodynamic
shock tube has a number of features which require a more detailed
numerical study. The analysis of the characteristics of the flow in the shock
tube of the Institute for Applied Mechanics, RAS, at the initial stage of
study is preferably to be carried out using an approximate one-dimensional
model, the elements of which are presented in this paper.
ISSN 0236-3941. HERALD of the BMSTU. Series “Mechanical Engineering”. 2014. No. 1 17