


 18 / 21

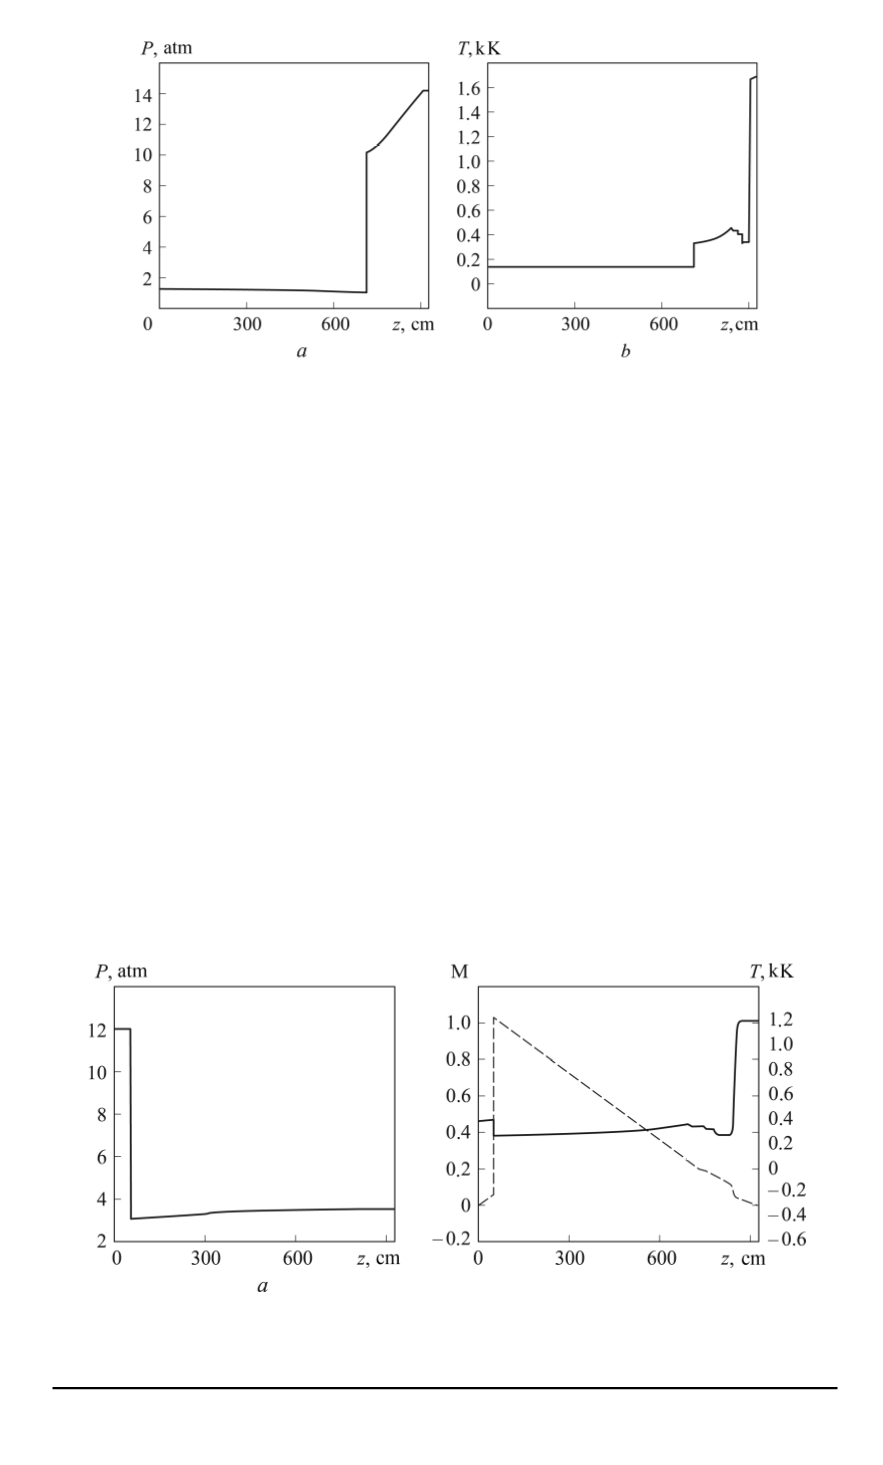
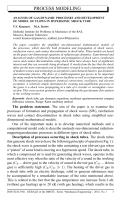
Fig. 6. Spatial distribution of pressure (
a
) and temperature (
b
) at the moment
t
= 3
.
4
ms (experiment 4)
medium into the less dense medium, then it will reflect from the contact
discontinuity in the form of a fan of rarefaction waves; b) if the case is
opposite – from the less dense medium into the denser one, - then the
reflection takes the form of a shock wave.
In the numerical computation done, the interaction type (
а
) has been
implemented, and the fan of rarefaction waves has been repeatedly reflected
from the shock tube wall and from the contact discontinuity. A bit later the
process of waves interaction is becoming more complicated, which results
from the influence of the reflected from the left boundary rarefaction wave.
Along with this, the temperature and pressure at the left boundary have
been equalized and reduced their values as compared to the previous phase
of flowing
T
≈
0
.
15
кK,
p
≈
1
.
5
atm.
The following flow structure (see Fig. 7) can be observed starting since
the moment of time 35 ms and it corresponds to the phase of the secondary
interaction of the shock wave reflected from the left computed boundary
Fig. 7. Spatial distribution of pressure (
a
), Mach number M (
b
) (dashed line),
temperature (solid line) at the moment
t
= 42
ms (Experiment 4)
20 ISSN 0236-3941. HERALD of the BMSTU. Series “Mechanical Engineering”. 2014. No. 1