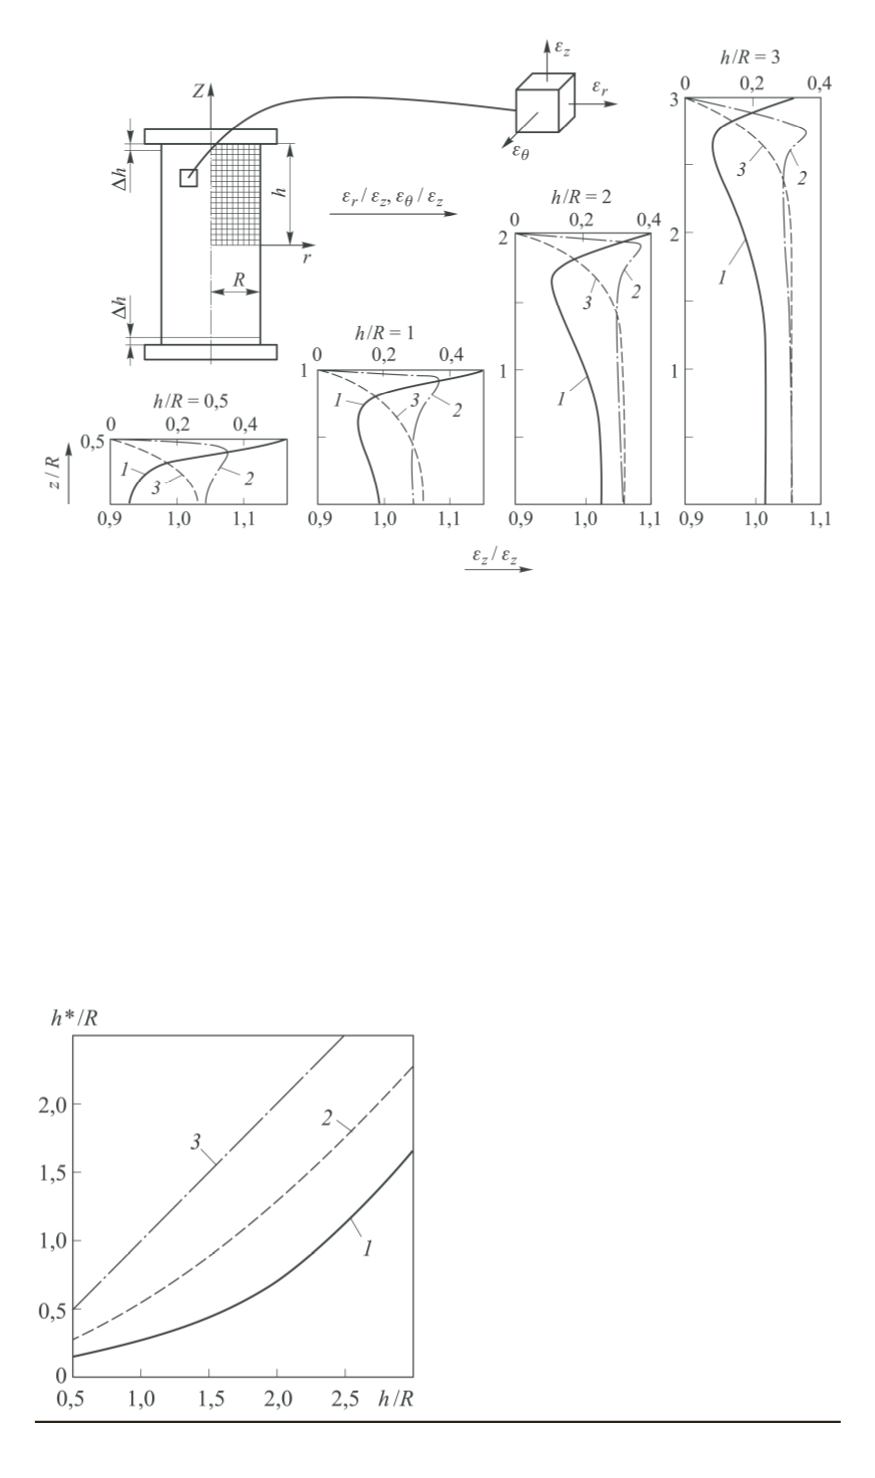
Fig. 1. Design model MFE and graphics of changes of axial
ε
z
(
1
), radial
ε
r
(
2
)
and tangential
ε
θ
(
3
) deformation relative to the average deformation (or strain)
ˆ
ε
z
= Δ
h/h
for samples with different relative height
h/R
measuring deformation 20 mm the height should be more than 40 mm. Thereat
the deviation of the distribution of deformation in the zone of measuring does not
exceed 1% from uniform one.
Solving the problems taking into account the plastic properties of material
graphs (figure 1) will have more smooth character and curves (figure 2) will be
raised a bit. This solution is inconvenient to use as the size of the zone with
the uniform distribution of deformation depends on the load due to the nonlinear
dependence between the tension and deformation. The elastic solution gives the
smallest size of this zone.
Fig. 2. The size of the zone with the
uniform distribution of deformation
h /R
depending on the relative sizes of
the sample
h/R
:
1
— the deviation from the uniform
distribution of the deformation in the zone
h /R
does not exceed 1%,
2
— the
deviation does not exceed 5%, the two
curves for solutions with infinite friction
at the ends of the sample,
3
— the solution
without friction
138 ISSN 0236-3941. Вестник МГТУ им. Н.Э. Баумана. Сер. “Машиностроение”. 2014. № 3


